Avalon Monitoring
This page provides a real-time overview of the disk usage across the Avalon instance. It helps administrators identify which components are consuming the most storage space.
Dashboard details
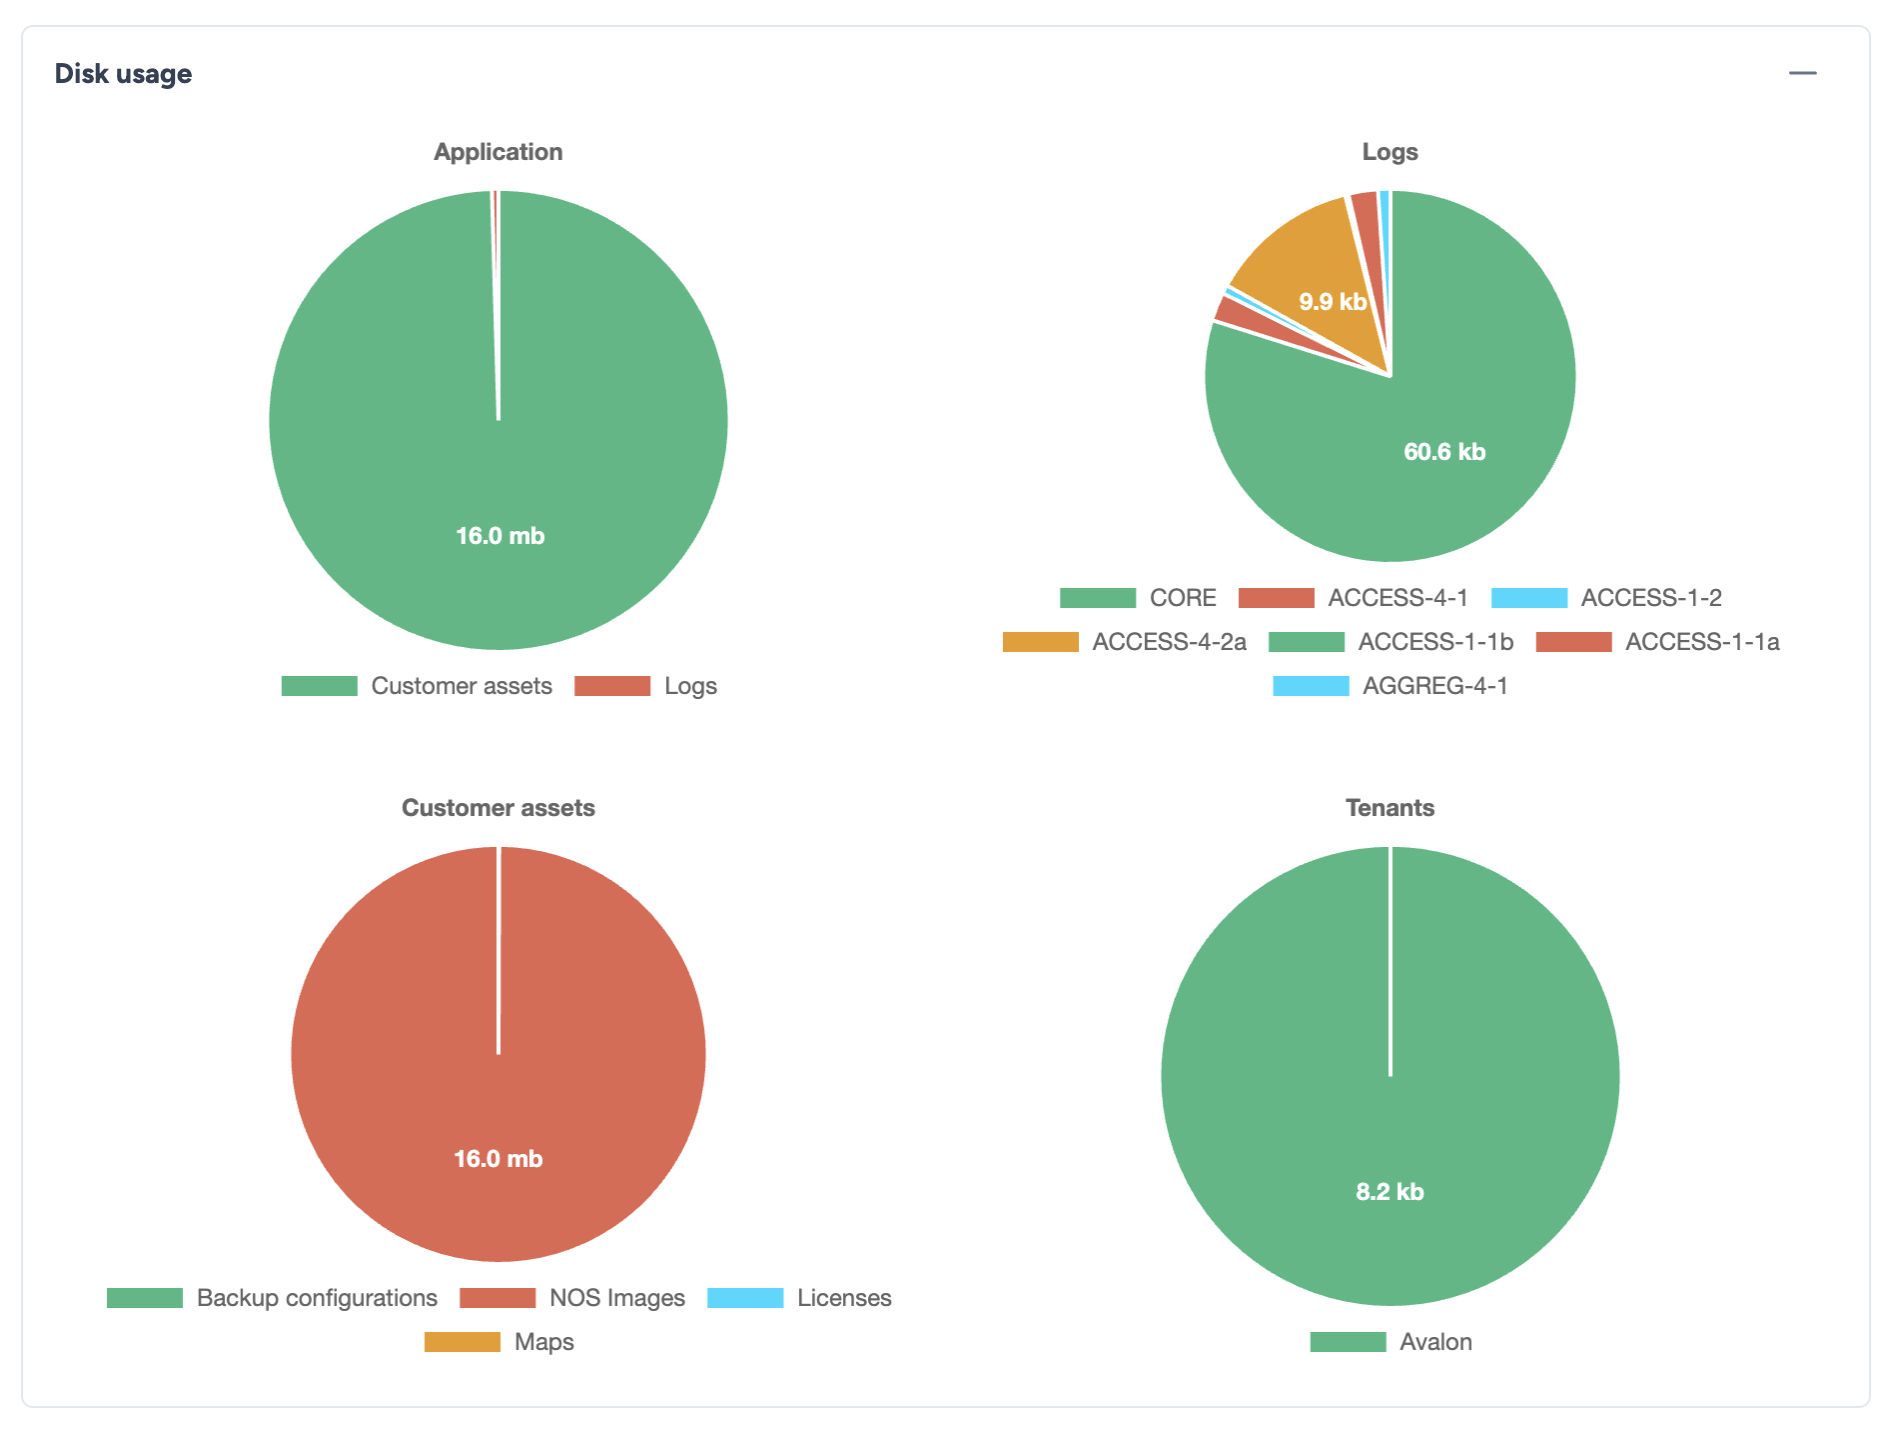
The view is divided into four main categories, displayed as pie charts:
- Application: Shows the space used by the core application files and assets (Core, Docker images, etc.).
- Logs: Details the storage consumed by various log files (system, access, error logs). This is typically where rapid growth occurs during debugging.
- Customer assets: Represents the files uploaded or generated for specific customers (NOS Images, backups, maps, etc.).
- Tenants: Displays specific storage usage per tenant for configurations backups.
Data Interaction
You can hover over any slice of the charts to view the exact file size and specific details in a tooltip.